Limiting Cases of Elasticity of Demand
advertisement
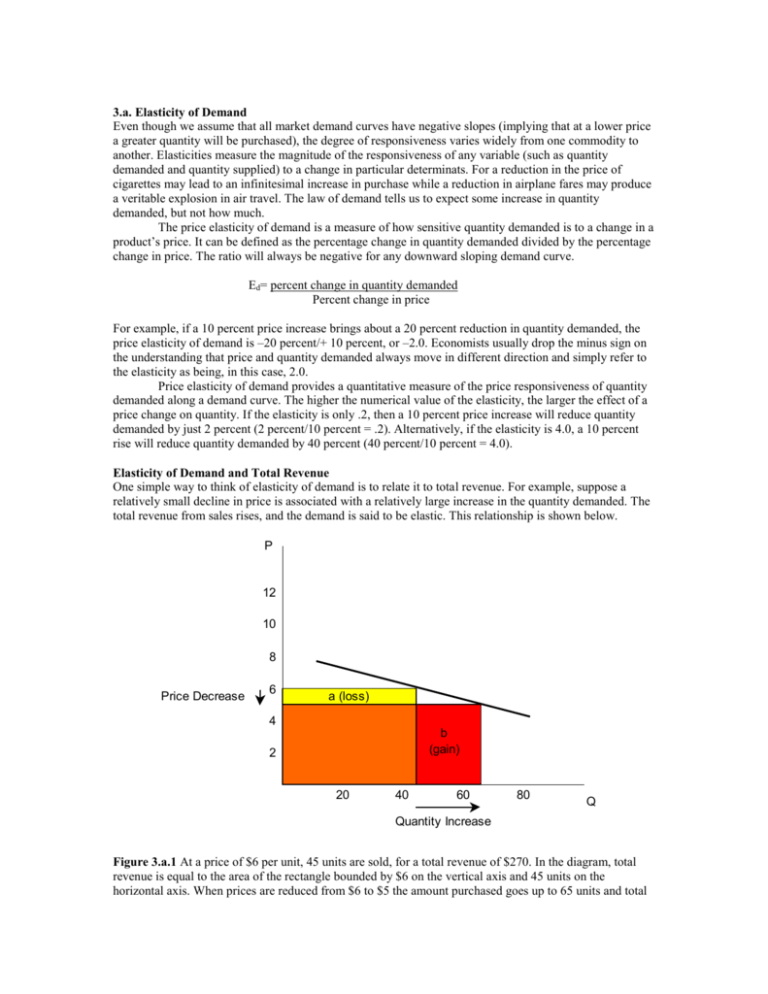
3.a. Elasticity of Demand Even though we assume that all market demand curves have negative slopes (implying that at a lower price a greater quantity will be purchased), the degree of responsiveness varies widely from one commodity to another. Elasticities measure the magnitude of the responsiveness of any variable (such as quantity demanded and quantity supplied) to a change in particular determinats. For a reduction in the price of cigarettes may lead to an infinitesimal increase in purchase while a reduction in airplane fares may produce a veritable explosion in air travel. The law of demand tells us to expect some increase in quantity demanded, but not how much. The price elasticity of demand is a measure of how sensitive quantity demanded is to a change in a product’s price. It can be defined as the percentage change in quantity demanded divided by the percentage change in price. The ratio will always be negative for any downward sloping demand curve. Ed= percent change in quantity demanded Percent change in price For example, if a 10 percent price increase brings about a 20 percent reduction in quantity demanded, the price elasticity of demand is –20 percent/+ 10 percent, or –2.0. Economists usually drop the minus sign on the understanding that price and quantity demanded always move in different direction and simply refer to the elasticity as being, in this case, 2.0. Price elasticity of demand provides a quantitative measure of the price responsiveness of quantity demanded along a demand curve. The higher the numerical value of the elasticity, the larger the effect of a price change on quantity. If the elasticity is only .2, then a 10 percent price increase will reduce quantity demanded by just 2 percent (2 percent/10 percent = .2). Alternatively, if the elasticity is 4.0, a 10 percent rise will reduce quantity demanded by 40 percent (40 percent/10 percent = 4.0). Elasticity of Demand and Total Revenue One simple way to think of elasticity of demand is to relate it to total revenue. For example, suppose a relatively small decline in price is associated with a relatively large increase in the quantity demanded. The total revenue from sales rises, and the demand is said to be elastic. This relationship is shown below. P 12 10 8 Price Decrease 6 a (loss) 4 b (gain) 2 20 40 60 80 Q Quantity Increase Figure 3.a.1 At a price of $6 per unit, 45 units are sold, for a total revenue of $270. In the diagram, total revenue is equal to the area of the rectangle bounded by $6 on the vertical axis and 45 units on the horizontal axis. When prices are reduced from $6 to $5 the amount purchased goes up to 65 units and total revenue goes up to $325. The new total revenue area is equal to the rectangle bounded by $5 on the vertical axis and 65 units on the horizontal axis. Rectangle b is larger than rectangle a which shows an increase in total revenue. Now suppose a relatively large decline in price were associated with a relatively small increase in quantity demanded. In this case total revenue would decline. Price Quantity Demanded Total Revenue $6 5 45 50 $270 250 That relationship is characteristic of inelastic demand. When total revenue does not change with a change in price, unit elasticity occurs. Price Quantity Demanded Total Revenue $6 5 45 54 $270 270 Measuring Elasticity of Demand Price elasticity of demand measures the responsiveness of changes in the quantity demanded of a particular good to change in its price: Ed= percent change in quantity demanded Percent change in price This relationship can be expressed as a formula, letting stand for price elasticity of demand: = (ΔQd/Qd) (ΔP/P) Here, (ΔQd/Qd) is the relative change in quantity demanded and (ΔP/P) is the relative change in price. This formula called the point elasticity formula is only to be used for small changes in price and quantity demanded as seen in the example below: P1= $2.00 Qd1= 2,000 P2= $1.99 Qd2= 2,005 If we enter the values for P1 and Qd1 into the formula we obtain = (5/2,000) = 0.5 ($0.01/$2.00) Alternatively, if we use P2 and Qd2, we obtain: = (5/2,005) = 0.49 ($0.01/$1.99) Because we are dealing with small changes, which values we choose makes little quantitative difference. The slight difference reflects the fact that the percentage change between two prices depends on the direction of the change. However, when a large change in price and quantity is involved we cannot use the point elasticity formula. Suppose that we have the following values: P1= $2.00 Qd1= 2,000 P2= $1.50 Qd2= 3,000 If we plug the values into the point elasticity formula we get 2.0 (using P 1 and Qd1) and 0.5 (using (P2 and Qd2). Both of these answers are incorrect. When dealing with large changes in price and quantity, we should use the arc elasticity formula: = ΔQd (1/2)( Qd1 + Qd2) ΔP (1/2)(P1 + P2) Plugging in the given values above = 1.0. In summary, the point elasticity formula works well when small changes in P and Qd are involved because, in that cases, which P and Qd are used makes little difference. The arc elasticity formula avoids the problem of having to pick one specific point by using the average values of price and quantity demanded and should be used with large changes in price and quantity demanded. Values of Elasticity of Demand Demand can be elastic, inelastic or have unity elasticity depending on the responsiveness of changes in the amount demanded to changes in price: Unit Elasticity (E= 1) A change in price causes an equally proportionate change in the amount demanded. When this happens there is no change in the total amount spent on the good. (Figure 3.a.2) Inelastic Demand (E< 1) A change in price causes a less than proportionate change in the amount purchased. In this case total revenue will rise if prices go up and fall if prices are reduced. (Figure 3.a.3) Elastic Demand (E> 1) A change in price causes a more than proportionate change in the amount purchased. In this case total revenue will fall if prices go up and will rise if prices go down. (Figure 3.a.4) Figure 3.a.2 Approximate Unit Elasticity P P 11 10 D 10 D 9.1 Q Q The price rises from $10 to $11, causing sales to fall from 10 to 9.1. Total revenue remains the same at approximately 100. The PQ rectangles in the two diagrams are roughly the same size. Figure 3.a.3 Inelastic Demand P P 11 10 D 10 D Q 9.5 A price increase from $10 to $11 is accompanied by a decline in purchases from 10 to 9.5. Total revenue from sale of the good have risen from $100 to $104.5. The second PQ rectangle is larger than the first. The elasticity of demand is –0.45. Q Figure 3.a.4 Elastic Demand P P 11 10 D 10 D 6 Q Q A price increase from $10 to $11 has brought total sales down from 10 to 6, and total revenues from $100 to $66. The elasticity of demand is 4. Limiting Cases of Elasticity of Demand The limiting case for inelastic demand is E= 0. In that case the quantity purchased remains the same, irrespective of price, and the demand curve is vertical. Figure 3.a.5 Perfectly Inelastic Demand P D E=0 Q The limiting case for elastic demand is one in which a price increase reduces sales and revenues to zero, while a price decline raises sales and revenues to infinity. Where demand is perfectly elastic the demand curve is horizontal. Figure 3.a.6 Perfectly Elastic Demand P E= infinity D Q Factors That Influence Price Elasticity of Demand The price elasticity of demand is influenced by the characteristics of the product or service. When there are lots of close substitutes for a good, price elasticity of demand is high. For example, ARCO gasoline is a close substitute for Shell gasoline. If the price of Shell gasoline goes up while the price of ARCO gasoline stays the same, the amount of Shell gasoline bought will decrease. Customers will shift to ARCO gasoline. The demand for Shell gasoline is elastic. When the amount spent on a good represents a large percentage of the average consumer’s income, a relatively small change in its price should have a relatively large impact on the quantity demanded. For example a 20 percent increase in the price for a gallon of milk will raise its price only 30-50 cents and should have little effect on the quantity. But a 20 percent increase in automobile price would mean about $2000 more. This is a substantial portion out of the average income and could mean a significant reduction in automobile purchases. We should expect that the demand for milk to be more inelastic than the demand of automobiles. When a good is a necessity without close substitutes, such as water, a rise in price will usually have little effect on sales. But if it is a luxury, such as chocolate, then the demand will more elastic under normal circumstances. The reason is that the necessity will have to be purchased even if the price is higher, while the luxury, by definition, need not be bough if the price rises. Other factors influence the price elasticity of demand for a commodity, but those mentioned above are probably more common.

