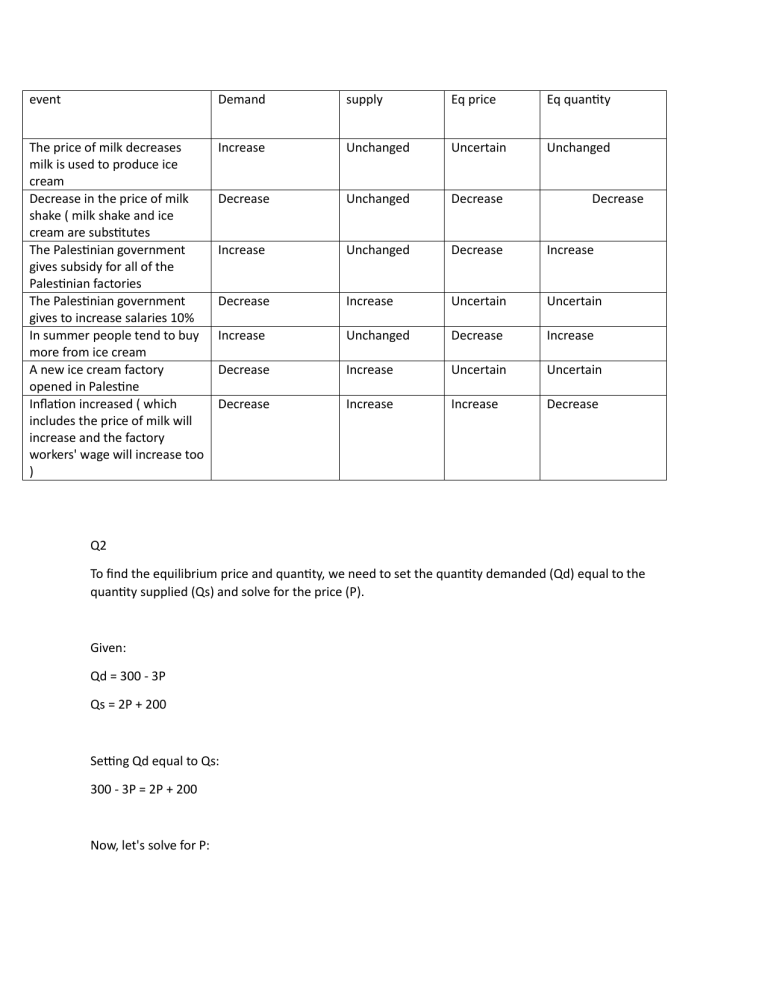
event Demand supply Eq price Eq quantity The price of milk decreases milk is used to produce ice cream Decrease in the price of milk shake ( milk shake and ice cream are substitutes The Palestinian government gives subsidy for all of the Palestinian factories The Palestinian government gives to increase salaries 10% In summer people tend to buy more from ice cream A new ice cream factory opened in Palestine Inflation increased ( which includes the price of milk will increase and the factory workers' wage will increase too ) Increase Unchanged Uncertain Unchanged Decrease Unchanged Decrease Increase Unchanged Decrease Increase Decrease Increase Uncertain Uncertain Increase Unchanged Decrease Increase Decrease Increase Uncertain Uncertain Decrease Increase Increase Decrease Decrease Q2 To find the equilibrium price and quantity, we need to set the quantity demanded (Qd) equal to the quantity supplied (Qs) and solve for the price (P). Given: Qd = 300 - 3P Qs = 2P + 200 Setting Qd equal to Qs: 300 - 3P = 2P + 200 Now, let's solve for P: 300 - 200 = 2P + 3P 100 = 5P P = 100/5 P = 20 Substituting the value of P back into either Qd or Qs, we can find the equilibrium quantity: Qd = 300 - 3P Qd = 300 - 3(20) Qd = 300 - 60 Qd = 240 Therefore, the equilibrium price is P = 20, and the equilibrium quantity is Q = 240. Now let's determine which equation represents demand and which represents supply. The equation with a negative coefficient for P (in this case, -3P) represents demand, while the equation with a positive coefficient (in this case, 2P) represents supply. Therefore, Q1 = 300 - 3P represents demand, and Q2 = 2P + 200 represents supply. To draw the curves showing the equilibrium points, we can plot the demand and supply equations on a graph. The x-axis represents the price (P), and the y-axis represents the quantity (Q). The demand curve: Q1 = 300 - 3P The supply curve: Q2 = 2P + 200 As for a supply surplus, it occurs when the quantity supplied exceeds the quantity demanded. In this case, at the equilibrium point (P = 20, Q = 240), there is no supply surplus because Qs = Qd. However, if we consider a different price point, such as P = 30, then we can calculate the corresponding quantities: Qd = 300 - 3P Qd = 300 - 3(30) Qd = 300 - 90 Qd = 210 Qs = 2P + 200 Qs = 2(30) + 200 Qs = 60 + 200 Qs = 260 At P = 30, Qd = 210, and Qs = 260. Since Qs > Qd, there is a supply surplus of 260 - 210 = 50 units. In summary: - Equilibrium price: P = 20 - Equilibrium quantity: Q = 240 - Q1 represents demand, and Q2 represents supply. - Equilibrium point: (P = 20, Q = 240) - There is a supply surplus at P = 30, with Qs = 260 and Qd = 210. Lastly here is the graph showcasing the equilibrium point at p=20 and q= 240 20---------- 240


